Business Consulting & Ops
Fractional ops leadership, Lean optimization, KPI frameworks, SOPs, and change management.
- Process audits & KPI design
- SOP libraries & training
- Executive reports & comms
We transform raw data and messy processes into beautiful, functional visuals your clients will love — executive dashboards, KPI scorecards, SOPs, warehousing optimization, teacher tools, and board-ready presentations. Built fast, built clean, built to move decisions forward.
Why ChartSmart: 20+ years across manufacturing, warehousing, and leadership. We blend operations know-how with sharp design so your team actually uses the tools we ship.
Clear, compelling visuals and documentation that move decisions forward.
Fractional ops leadership, Lean optimization, KPI frameworks, SOPs, and change management.
On-brand visuals for PPT/Sheets/PDF: variance charts, scorecards, yield/quality & financials.
IEP trackers, behavior data sheets, standards-aligned task boxes, and monthly teacher bundles.
Two decades of experience—layout optimization, slotting, pick paths, WMS reporting, and labor models.
Representative samples—deliverables are customized to your brand and workflow.
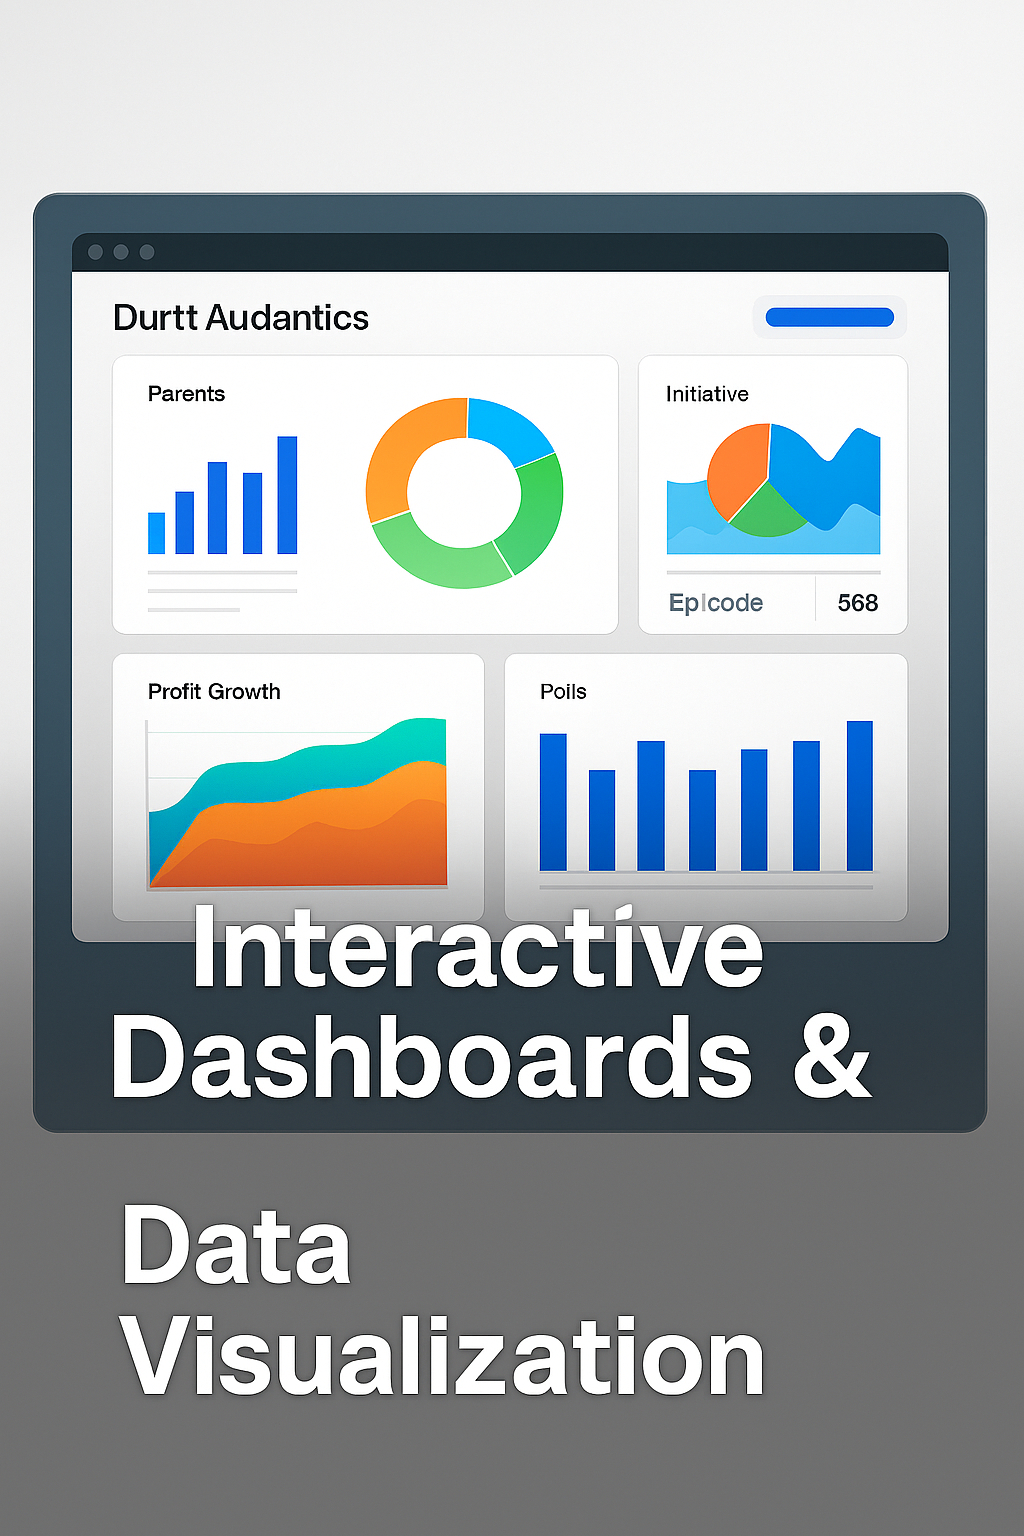
Targets, trend lines, and variance call-outs for fast decisions.
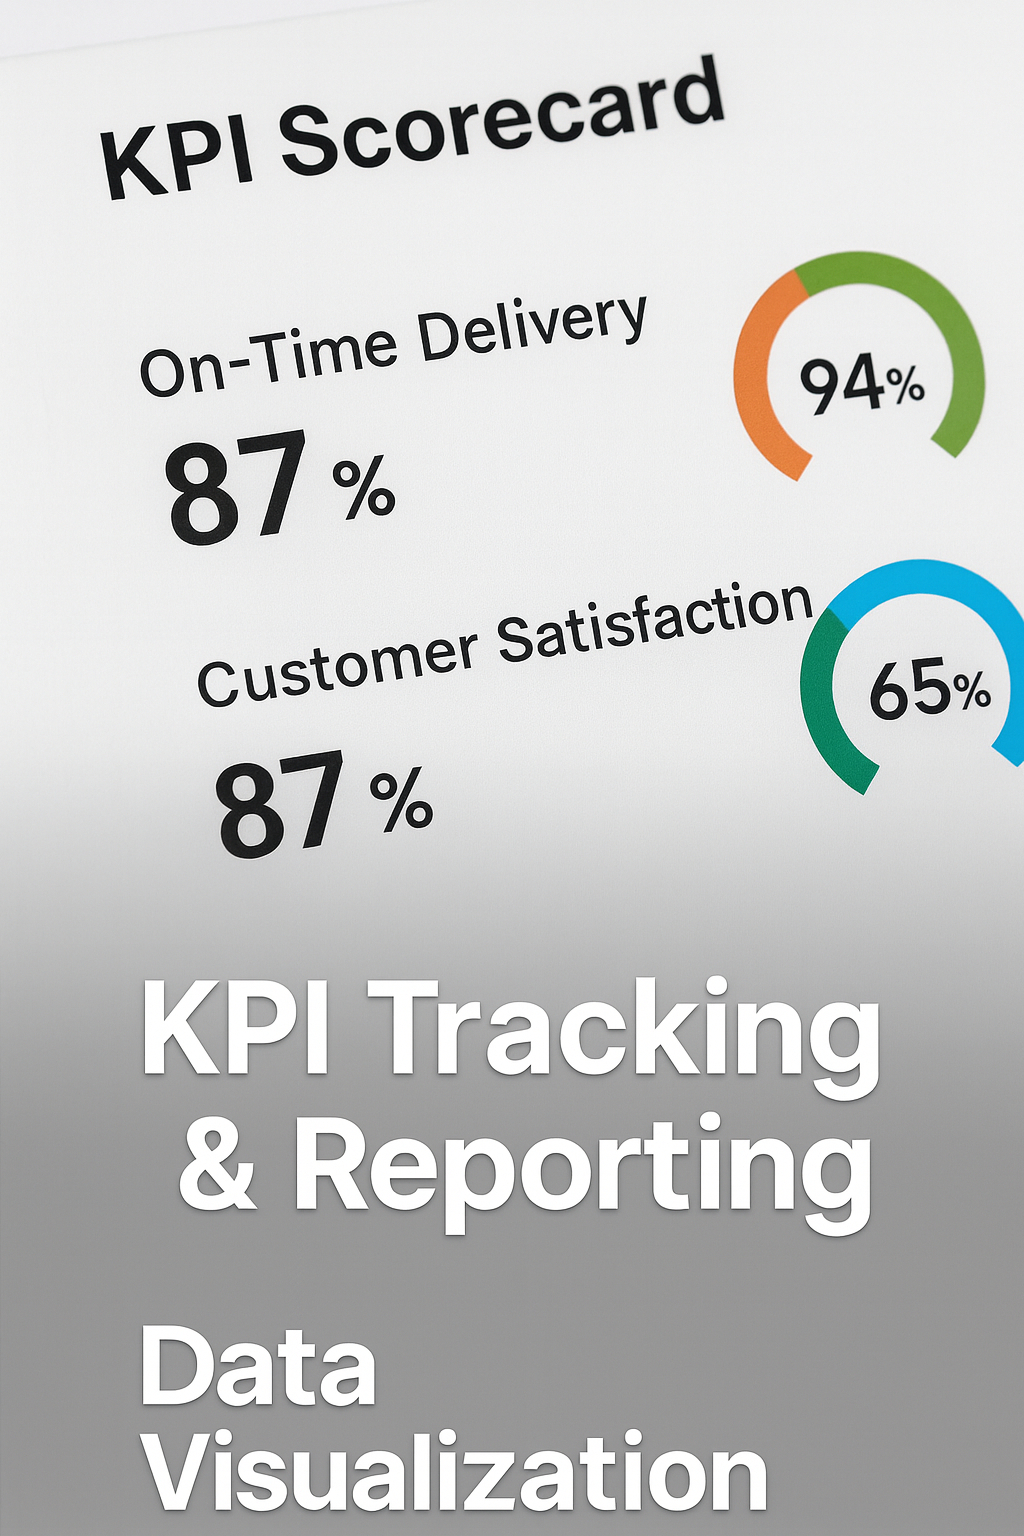
Monthly/weekly rhythm with RAG status and owners.
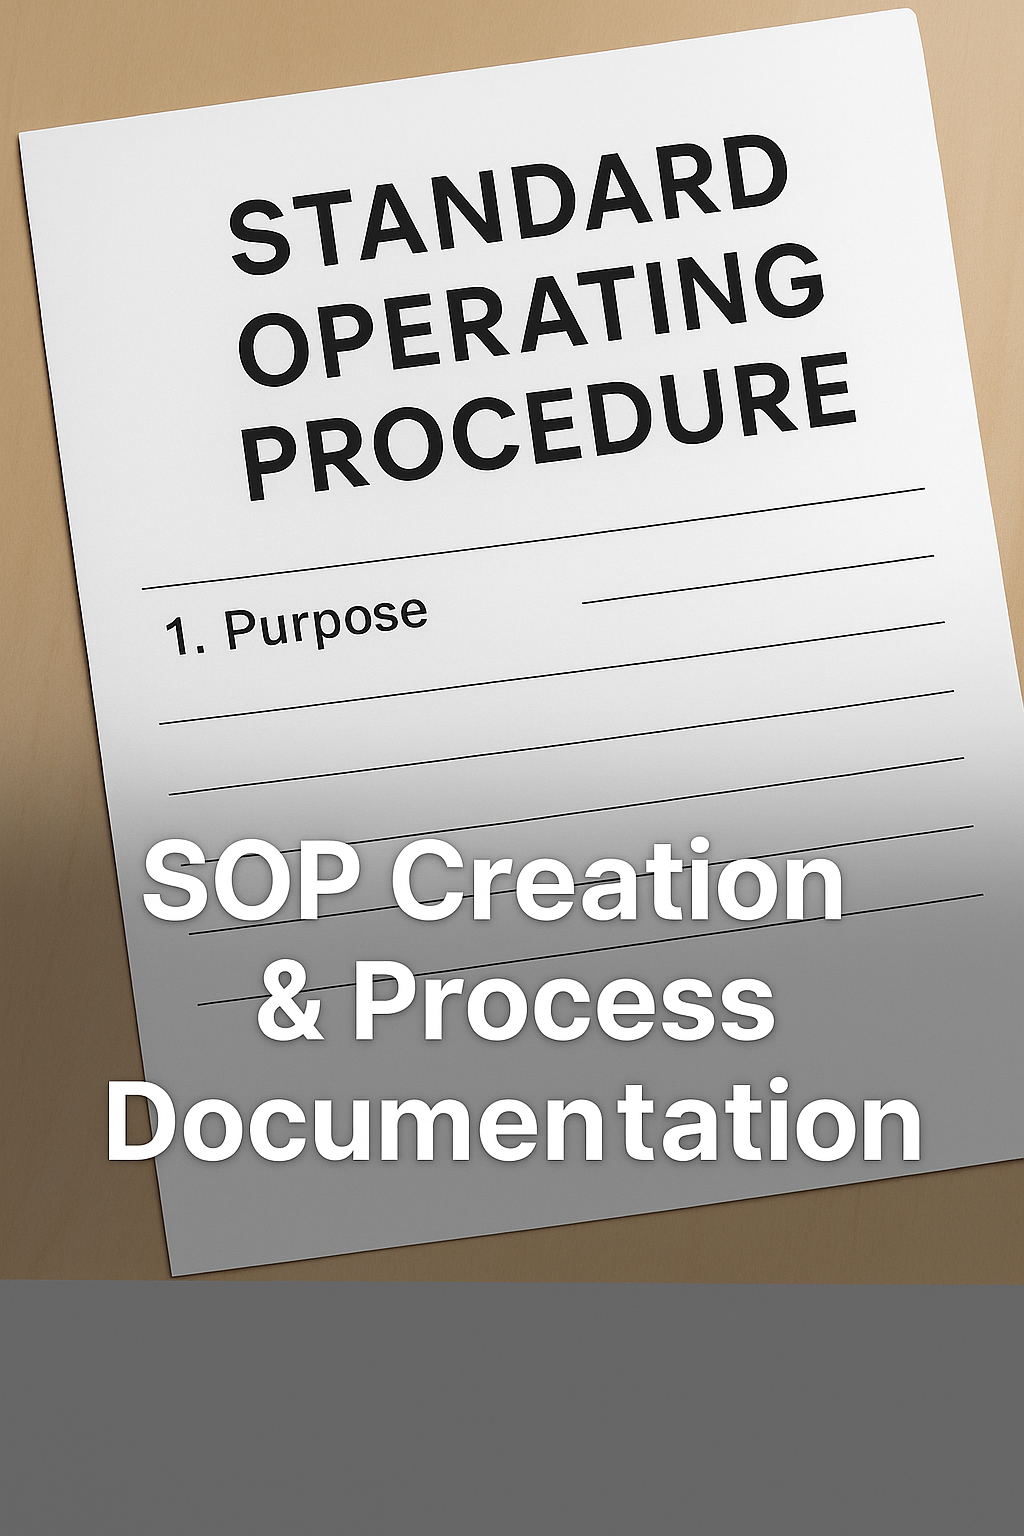
Versioned SOPs with checklists, training slides, and sign-offs.

Slotting, pick-path heatmaps, and staffing calculators.

Standards-aligned trackers, task boxes, and presentation kits.

On-brand decks with clean charts and a strong executive narrative.
Transparent ranges—most projects land between these tiers.
Led by David Gaddis (Evansville, IN). 20+ years in manufacturing, warehousing, and team leadership. I combine operational experience with clean design to ship dashboards, SOPs, and layouts that people actually use. Read the full story →
Tell me what you need. Attach files or a quick data dump—I’ll take it from there.